
Vilfredo Pareto was an engineer, sociologist, economist and philosopher, born in Paris on July 15, 1848, he established the Pareto principle also known as the 80/20 rule and the law of the vital few, by this principle he explains statistically that in any population set of all types that contributes to a common effect, it is a small proportion that contributes to most of the effect.
The name Pareto Diagram was given by Joseph Juran in honor of the economist Pareto, who conducted a study on the distribution of wealth, in which he discovered that the minority of the population owned most of the wealth and the majority of the population owns the least wealth. With this he established the so-called “Pareto’s Law” according to which economic inequality is inevitable in any society.
The application of this principle in companies can be found in the value chain in which 80% of the processes in the chain are achieved with 20% of the activities, here we can find a perfect example, consider all the wealth in the world, 20% of the population owns 80% of the total wealth, According to the International Monetary Fund, the gross domestic product of the 196 countries in the world in 2011 was US$79 trillion and about US$63 trillion (80%) is contributed by only 22 countries, so 80% of the wealth is concentrated in only 9% of the countries in the world.

US$15 trillion or 19% of total wealth is produced by a single country, the United States, so 19% of the world’s wealth is produced by 0.5% of all countries globally (Ref: World Economic Forum, October 2012).
This 80/20 principle is a methodology widely used in RCA (Root Cause Analysis, (for more information you can consult our ebook: CMMShere – Root Cause Analysis in Maintenance Management) for the determination of the origins of failure modes in parts, systems or processes involving assets that are susceptible to corrective maintenance or repair.
What is a failure?
A failure is any condition that affects the normal or considered standard operation or functionality of an equipment, machine or process and that is susceptible to immediate corrective maintenance depending on the severity classification of the asset within the process area.
There are two types of failure, the functional failure is the one that prevents equipment from continuing in operation and a potential failure is the one that the failure does not disable the equipment to remain functional, but at a certain time under certain operating conditions can cause a functional failure, for example excessive noise in rotating parts that are linked to a bearing, the equipment can continue to operate but it is certain that the bearing at any time will fail causing the asset to go out of operation.
In order to mitigate the events caused by failures in assets and allow to reduce maintenance costs and decrease the amount of spare parts in inventory, it is essential to perform failure analysis, in order to analyze the event in depth, either in parts or as a whole system or subsystem to which the asset belongs, determine the cause of the failure and from that cause determine the corrective actions and their implementation, which will lead to a decrease in the failure rate over time, thus providing various benefits both for the effectiveness of the maintenance team and for business productivity.
Preventive maintenance also allows to decrease the failure rate, in new equipment this type of maintenance will work perfectly (for more information see our ebook: CMMShere – Types of Maintenance), but most likely the manufacturer will take the equipment to ensure its warranty to an over-maintenance, in turn will be building the history of maintenance and failures that will enrich the subsequent failure analysis to start a stage of maintenance based on reliability.
Pareto methodology in maintenance
The Law of 80/20 Priorities states: “80% of the problems that occur in any activity are caused by 20% of the elements involved in producing them”. Applying this principle to maintenance management, it is quite certain that a reduced number of elements are responsible for the majority of asset failures or that a reduced number of assets cause the greatest technical maintenance burden.
The method of analysis of this principle is the ABC diagram and serves to achieve the highest level of improvement with the least possible effort. It is a graphical representation of the data obtained on a problem, which helps to identify and select the priority issues to be addressed.
What are the steps to follow to graph the law of priorities:
- The source of the list of failures is the CMMShere, this software has the ability to store all the failures of an asset and show all the costs associated with its repair such as personnel costs, costs of supplies and spare parts and other costs that can be executed in specialized third parties.
- Design a table, in the first column write down the failures of the asset in decreasing order of their associated costs.
- In the second column, calculate and record the relative percentage or relative weight of the costs presented in each case.
- In the third column write down the cumulative value of that percentage.
- Plot the resulting curve of cumulative percentages from left to right on a graph.
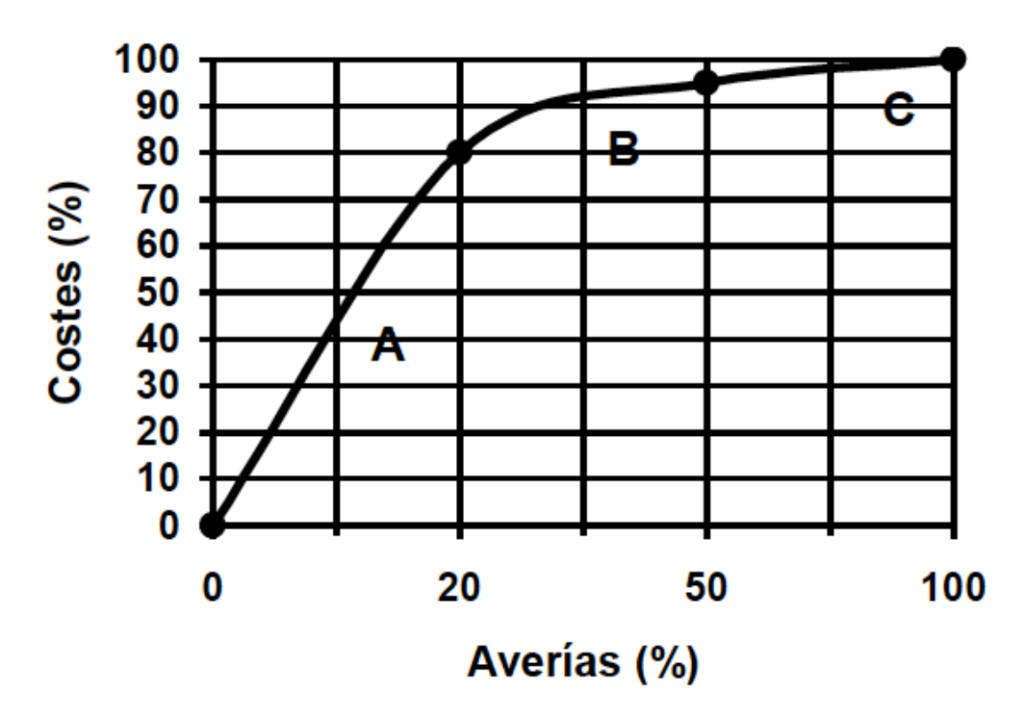
Three areas can be identified in the graphic representation:
A area: In most analyses, the pareto principle applies: 20% of the failures cause 80% of the maintenance costs.
B area: From 20% to 50% of the failure events, i.e. 30% of the total, cause 15% of the corrective maintenance costs.
C area: 50% of asset failure events cause 5% of the total cost.
Results Analysis:
With the results obtained graphically and in conjunction with the tabulated data, the following actions to be implemented in the asset maintenance management can be deduced.
- The failures located in area A, will be susceptible to strict follow-up, implementing preventive maintenance actions, maintaining adequate inventory stocks of spare parts and supplies and calculated in conjunction with the average MTBF failure rate and additionally it is recommended to run a deeper RCA analysis to detect possible failures in terms of design, installation, operating conditions, quality of parts, improvement of alloys, electrical protection among other more corrective actions that can be implemented to reduce the costs incurred.
- Failures located in area B, have a lower effort requirement in terms of workload and costs and will require lower business capabilities that can be transferred to other assets with equal or higher criticality.
- The failures located in area C, will require much less resources, although the failure rate is higher, this could cause an increase in work order scheduling and it would be recommended to implement engineering improvements and optimization of maintenance procedures to reduce the workload caused by the frequency of minor failures.
Application example:
The Pareto analysis for a failure history and its costs in a centrifugal pump with mechanical seal can be seen below:
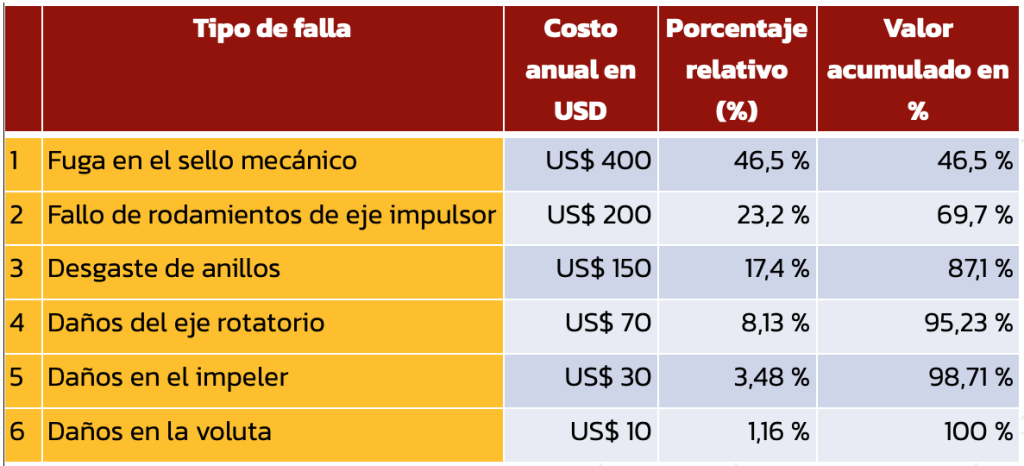
Equipment failure history:
It is then plotted on a graph of the number of the type of failure versus the cumulative value in %:
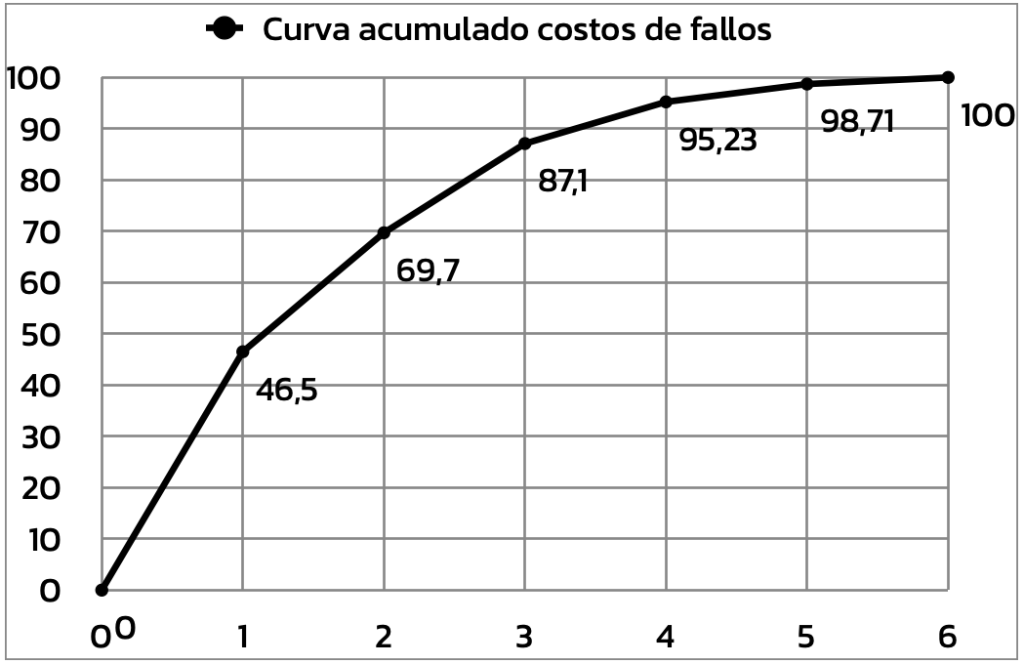
Several analyses can be made of the ABC type graph curve obtained, failures 1,2,3, mechanical seal failure, impeller bearing failure and ring wear respectively, correspond to 87.1% of the annual maintenance costs associated with centrifugal pump failures, several situations that need corrective action can be concluded:
- The mechanical seal used is not of good quality; cheap is expensive in the medium term.
- The installation process of the mechanical seal is incorrect, excessive torque or stress may be applied causing micro-fractures in the seal material.
- Pump operating pressure is above design pressure (condition-based maintenance).
- The fluid moved by the pump is corrosive or not compatible with the mechanical seal materials (e.g. diesel, caustic soda)..
- The vapor pressure of the fluid is above the operating pressure causing the appearance of micro bubbles that collide with the entire inner body of the pump.
- The lubricant used is not recommended for pump operation.
- Water or fluid enters the chamber where the lubricant is stored, causing contamination and no or reduced lubrication capacity.
- Lubricant is not replaced with adequate frequency.
- The pump shaft is not aligned between the electric motor and the rotating body.
- The fluid moved by the pump is very viscous and the equipment selection was incorrect based on this variable.
- The fluid head (NPSH) at the suction point causes overpressure in the pump.
- Air enters the pump at some point.
- The impeller diameter is not suitable for the pump size.
- The temperature of the fluid is very high and affects the internal mechanisms of the pump.
Many conclusions can continue to be drawn about the failures that the asset has had during the year, through an RCA analysis, the real causes of failures 1, 2 and 3 would be determined and thus corrective actions would be implemented to reduce that 87.1% of the costs.
By means of a CMMS that allows timely scheduling of preventive maintenance and monitoring of parameters such as temperature and pressure, the maintenance area would be able to anticipate failures and jointly reduce costs and the workload required by the asset.
Other Views of Analysis Using the Pareto Methodology
The application of the Pareto principle is very versatile, many variables can be analyzed in function of the same result: the failure analysis, this is one of the most important management indicators since a conscientious study of the results and the implementation of corrective actions brings many benefits, only by applying the principle “Separate the vital few from the trivial many“, it solves a lot of effort in problem solving.
It is possible to make different analyses, extracting the information from a CMMS (for more information of our CMMShere consult our Ebook: Computerized Maintenance Management Systems) the frequency of failures of the asset, building a graph with the accumulated in failure numbers or in failure hours per corrective maintenance event, taking into account the totals of one or the other, for any period analyzed:
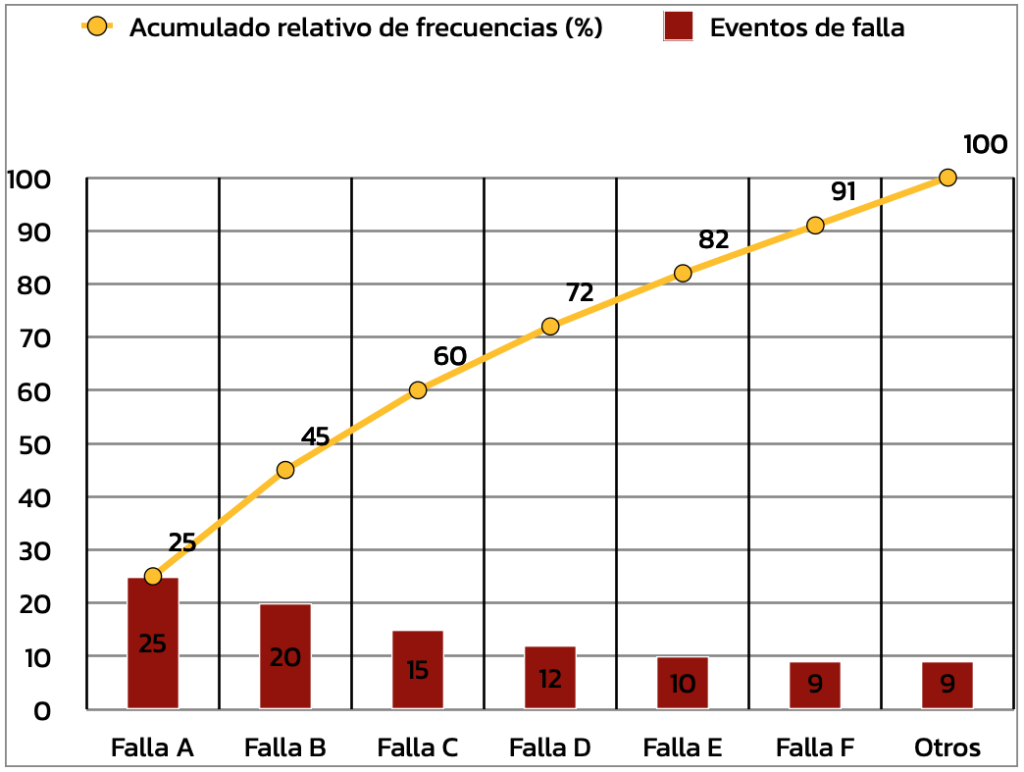
In this theoretical case, it can be seen that failures A,B,C,D and E contribute to 82% of the total frequency of failures in the asset, therefore efforts should be focused on mitigating or reducing the failure rate by implementing corrective actions.
Graphical analysis can be continued by type of maintenance, such as amount of preventive maintenance per asset, amount of repairs or corrective maintenance, monitoring of variables by condition, repairs by defects, use of certain spare parts in assets, also the methodology is applicable to deeper analysis, such as electrical failure mode and in this sub types would be plotted, such as electrical shorts, misalignments, current peaks, potential factor among others.
Uses of the Pareto Methodology
Thanks to its dynamism and focus on separating the vital from the trivial, the methodology can be applied in various fields:
- Identification of improvement points, design changes and optimization of equipment installation.
- Evaluate the results obtained from the implementation of corrective actions, making a parallelism between before and after in a maintenance procedure, production process or the provision of a maintenance service for third party equipment.
- It can contribute to root cause analysis as a complement to the cause and effect study of failure events.
- Analyze groupings of data that have a common purpose.
- Improve the quality of a product or service by analyzing PQR’s and satisfaction surveys.
- It is a decision-making and problem-solving tool for managers rather than being in “fire-fighting” mode.
The Pareto methodology at CMMShere
Keeping the failure history of an asset or all the assets of an organization in spreadsheets is wasteful, inaccurate and null in real time, our CMMShere has the capabilities to apply this methodology and obtain its benefits:
- CMMShere has the ability to assign faults to assets, indicate how the fault was detected, customize the classification according to the organization’s fault coding, assign the apparent cause of the fault and its seriousness.
- CMMShere takes into account whether the failure has caused other assets in the process chain to go out of operation and determines repair times.
- You can access a complete failure graph with all the information to perform a Pareto analysis for the time periods under study.
For more information about our CMMShere, you may consult:


No comment yet, add your voice below!